



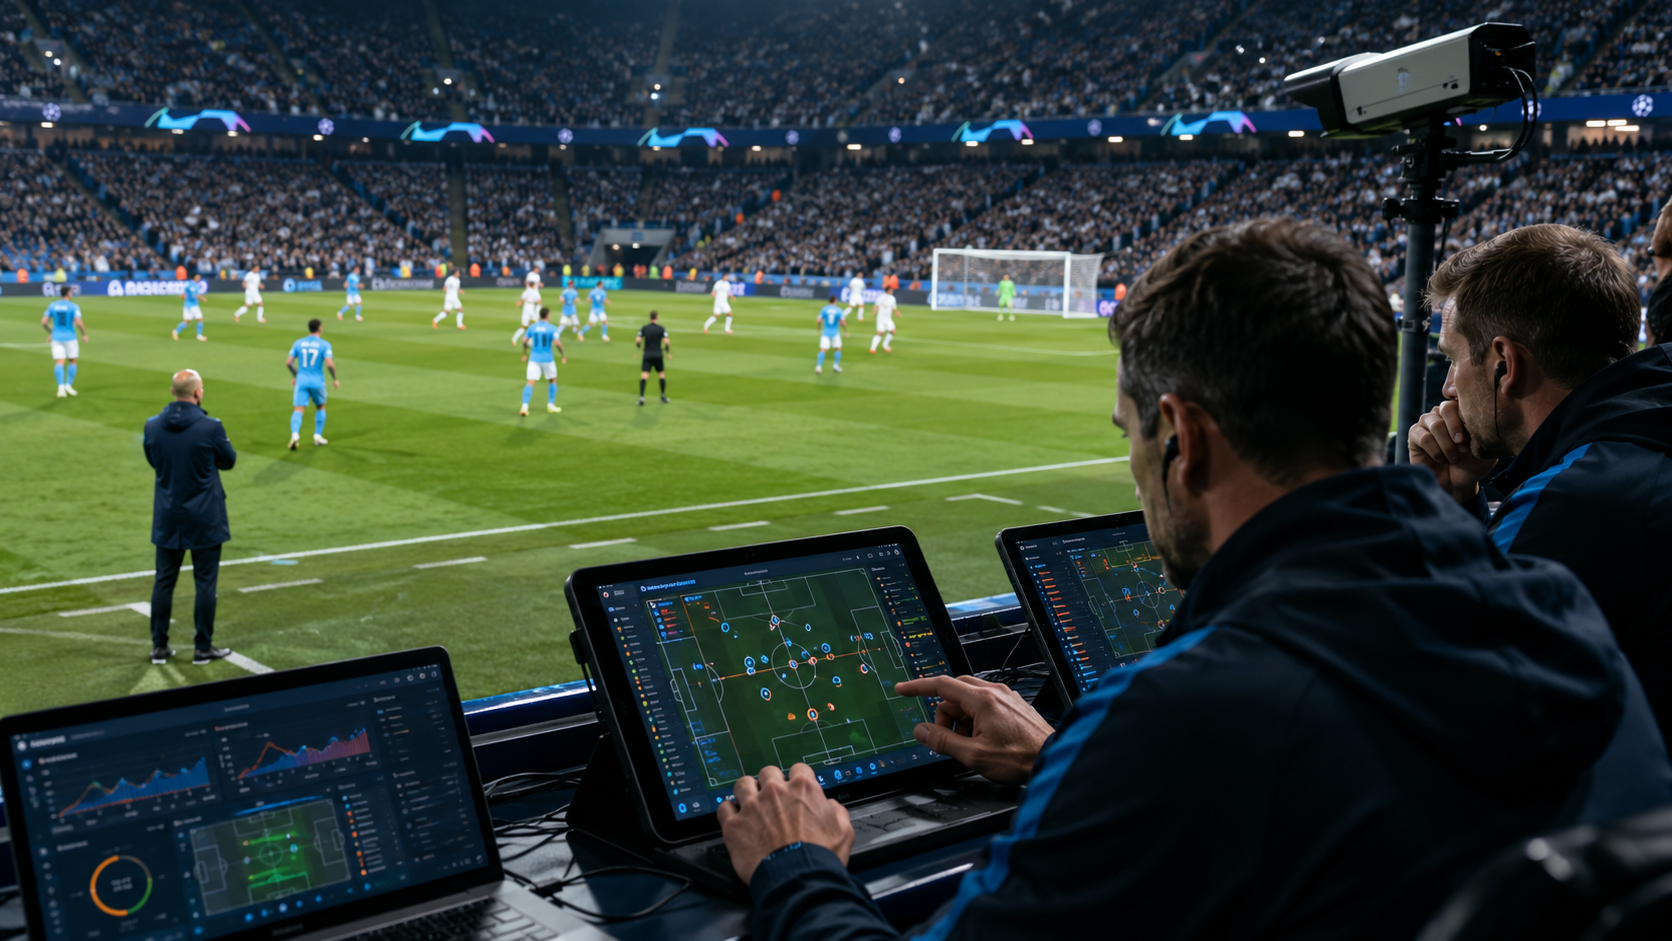
If you grabbed a seat near the dugout at MetLife Stadium during the 2026 World Cup final, you probably noticed something strange right away. The stereotypical manager stomping around the touchline, wildly waving hands and screaming at full-backs, was barely there. Instead, secondary coaches sat crouched over glowing screens, running fingers across real-time tactical maps while the game raged on just twenty yards away.
That second half flipped fast.
Before the break, the team in blue was getting completely choked out. Their center-backs could not clear the ball past their own penalty arc without getting swarmed by three attackers. It felt like watching a slow-motion wreck.
Then came the second forty-five minutes.
No panic substitutions. No obvious change in formation on the TV graphics. Yet suddenly, the underdogs were easily bypassing the press. All it took was a subtle tweak: dropping one central midfielder four paces back and nudging the wing-backs out to the touchline by a couple of yards. That tiny bit of extra breathing room stretched the defensive lines to a breaking point.
Most people in the stands thought it was pure grit. In reality, an analytical script running on a tablet had flagged that precise micro-gap long before the whistle blew for halftime.
Tracking technology in sports used to be about post-match recaps and basic heatmaps published a day late. Now, roof-mounted optical cameras capture physical coordinates thirty times every second for every single player. The software runs thousands of calculations per minute, checking passing lanes, spacing efficiency, and turnover probabilities on the fly.
When a defensive player starts taking half a second longer to recover their position after a sprint, the tablet spots that fatigue pattern way before a human eye notices the slump in their shoulders.
That constant flow of raw data changed how people watch sports from home, too.
We care much less about raw possession percentages these days. Passing the ball sideways in your own half for fifty minutes looks impressive on paper, but it yields almost zero real value. Modern fans want to see structural control instead. Dedicated sports statistical platforms like BETBOOM provide supporters with detailed live match metrics, performance tracking, and deep statistical coverage across football, tennis, and basketball, letting anyone break down the tactical realities of a match as it happens.
A few specific metrics shifted how we talk about modern tactics:
- xG value over random shot counts: Desperate long-range strikes from thirty yards out add almost nothing to the sheet. A messy scramble tapped in off a knee right at the goal line counts for exponentially more.
- Passes Per Defensive Action: PPDA measures how many passes a team allows before throwing a tackle. It shows true pressing intensity, cutting through lazy commentary.
- Fluid spatial maps: Paper team lineups are mostly irrelevant now. Heatmaps prove how a basic 4-3-3 morphs into a lopsided 3-2-5 the instant possession shifts.
Computer models will never fully consume the sport. You cannot code an acrobatic overhead kick or an impossible double save in stoppage time. Human emotion and split-second instincts still rule the pitch, but the tactical choices dictating those moments are now guided by quiet algorithms running in the background.