



Few things in poker feel as unfair as a long losing stretch when you are sure your decisions are good. Most players, including those grinding on poker-bc.com, assume that a few thousand hands should be enough to show whether they are winning, so a result in the red feels like proof of a mistake. The mathematics says otherwise: even a profitable player can finish a 50,000-hand sample behind. To show how large the effect is, this article uses a simulation of 20,000 winning players and looks at what their results actually look like. The numbers are uncomfortable, but they also explain why patience and bankroll rules matter so much.
What “Losing 50,000 Hands” Really Means
Poker is not won or lost hand by hand. When people talk about a losing stretch, they mean the net result over a block of hands, usually measured in big blinds. A player can make a correct decision and lose the pot, or make a mistake and win it. Over a few hands, luck dominates. Over thousands, skill pulls the average upward, but the swings around that average remain large.
The statistic that measures those swings is standard deviation, usually quoted per 100 hands. In no-limit hold'em, values somewhere around 80 to 100 big blinds per 100 hands are commonly cited. Compare that with a typical win rate of a few big blinds per 100, and you can see why results move so much more than skill does.
The Simulation Setup
To keep things concrete, the figures below come from a simple Monte Carlo simulation with these assumptions:
- Win rate: 5 big blinds per 100 hands, a solid result at many stakes.
- Standard deviation: 90 big blinds per 100 hands.
- Results modeled as normally distributed in blocks of 100 hands.
- 20,000 simulated players, each playing 100,000 hands.
This is a simplification, since real results have heavier tails, but it is accurate enough to show the scale of the effect. Every simulated player is a long-term winner who makes no mistakes in the sense that their true edge never changes.
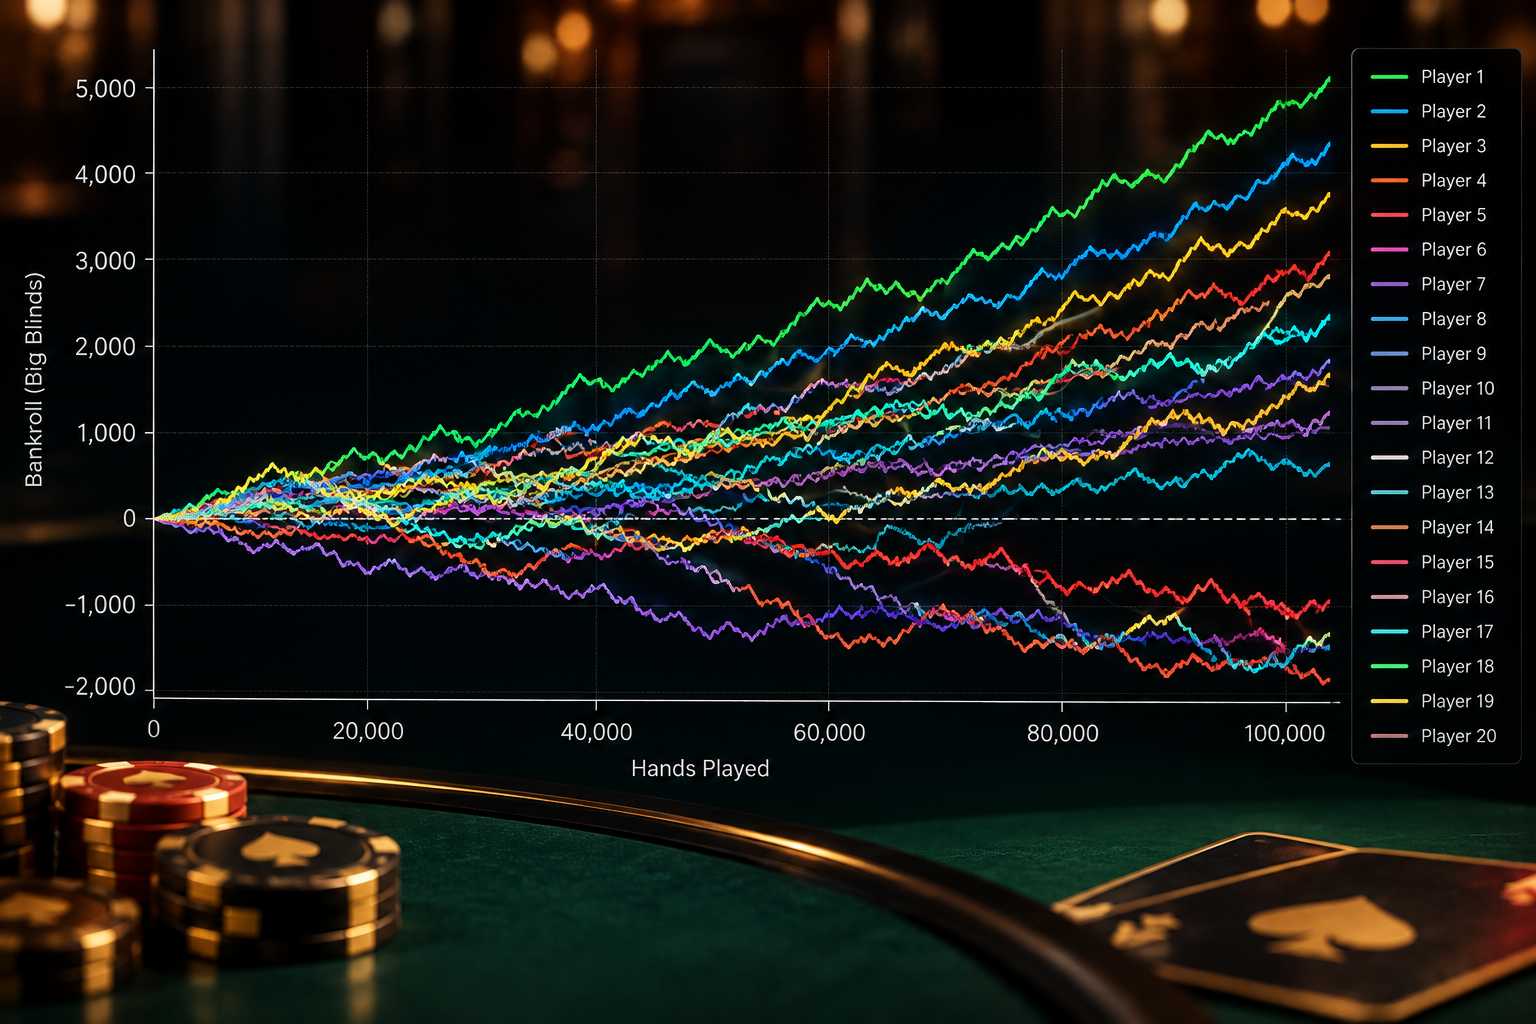
Result 1: How Often Does a Winner Finish in the Red?
| Hands played | Expected profit | Chance of still being behind |
| 10,000 | 500 BB | about 30% |
| 20,000 | 1,000 BB | about 22% |
| 50,000 | 2,500 BB | about 11% |
| 100,000 | 5,000 BB | about 4% |
Even after 50,000 hands, roughly one in nine of these winning players is losing money. After 10,000 hands, which many people consider a meaningful sample, nearly one in three is behind. A negative result at that point says very little about skill.
Result 2: How Deep Do Downswings Go?
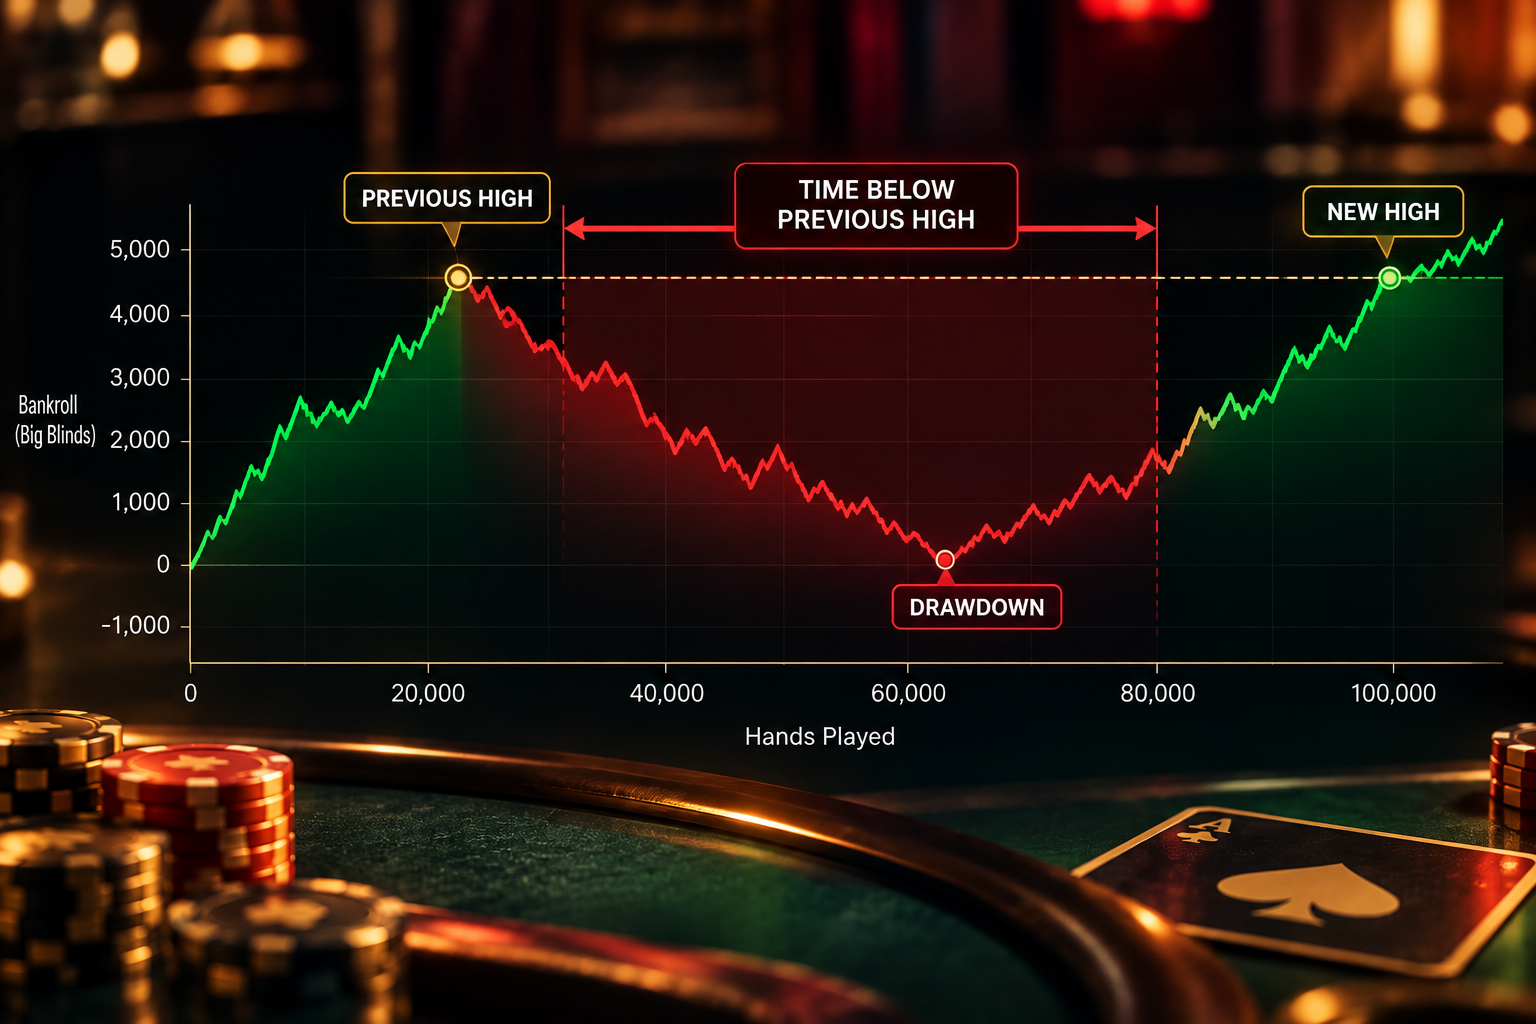
Drawdown measures the distance from your highest balance to the lowest point that follows it. In the simulation:
- The median player experienced a maximum drawdown of roughly 1,900 big blinds, around 19 buy-ins of 100 big blinds.
- One in ten players saw a drawdown of more than about 3,100 big blinds.
- About 11% of players hit a drawdown of 30 buy-ins or more at some point within 100,000 hands.
That is for players whose edge never wavers. Anyone who treats a 20-buy-in downswing as proof of a leak will draw the wrong conclusion most of the time.
Result 3: How Long Can You Go Without a New High?
Perhaps the most striking measure is time spent below a previous peak. The median simulated player spent a stretch of about 28,000 consecutive hands without setting a new high. One in four had a stretch of over 42,000 hands, and about one in ten went beyond 60,000.
Looking at fixed windows tells a similar story. Within a 100,000-hand career, about 43% of the simulated winners had at least one 50,000-hand window in which they lost money overall. For 20,000-hand windows, the figure was above 95%. In other words, a 50,000-hand losing stretch is not a freak event for a winning player; it is something that happens to a large share of them.
Why It Feels Like You Are Playing Badly
Human brains look for explanations. When results turn negative, you start searching for a leak, and with enough searching you will find one, because every player has some. That creates a loop: you change your strategy because of a sample that did not justify the change, results swing again, and you change something else.
Another effect is that bad outcomes are more vivid than good ones. A river suck-out sticks in memory, while a hand where you caught a card on the river and won feels like normal poker. Over time, the mind collects evidence for the story it already believes.
What to Do About It
- Judge decisions, not outcomes. Review hands for the quality of the line, not for who won the pot.
- Track your results, but treat short samples with suspicion. Anything under tens of thousands of hands is mostly noise.
- Use all-in adjusted results when your software provides them, since they remove part of the luck from big pots.
- Keep a bankroll large enough for a 30-buy-in swing. If a downswing of that size would force you to stop, you are playing too high.
- Set review triggers based on process, such as a fixed number of hands, not on mood.
- Protect your mental game. Long downswings are a common trigger for tilt, so predefine your stop-loss and break rules.
What the Numbers Say About Patience
A losing 50,000-hand stretch can be a mathematical certainty for large groups of correct players, not a verdict on your skill. The practical lesson is to build a game and a bankroll that can survive the variance, then let the sample grow. Skill shows itself slowly, and the players who last are the ones who can wait for it without rewriting their strategy every time the graph turns down.